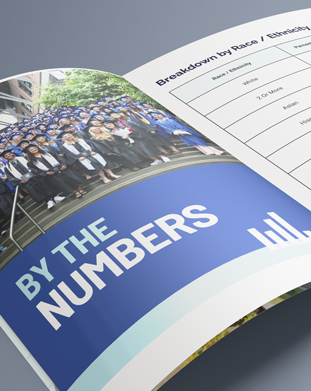
Cascadia by the Numbers
Take a closer look at our student body, and see how Cascadia is unique from other community colleges. For starters, Cascadia has the youngest median age and the highest percentage of students who want to transfer to earn 4-year degrees.

Top In-state Transfer Destinations
- UW Bothell - 48%
- UW Seattle - 15%
- Central Washington University - 9%
- Western Washington University - 9%
- Washington State University - 9%
The State of Washington does not maintain a database to show out-of-state transfers from community colleges
Median Student Age
20 years old
Breakdown by Race / Ethnicity
| Race / Ethnicity | Percent of Headcount |
|---|---|
| White | 42% |
| 2 Or More | 14% |
| Asian | 21% |
| Hispanic | 11% |
| Undisclosed | 7% |
| Black / African American | 4% |
| American Indian/Alaska Native | < 1% |
| Native Hawaiian / Pacific Islander | < 1% |
Other Student Facts
Full Time Students
56%
Part Time Students
44%
| Student | Percent of Headcount |
|---|---|
| Identify as LGBTQIA | This information is not collected by Washington state community and technical colleges. |
| Learning English as Another Language | 16% |
| First generation in their family to attend college | 23% |
| Received need-based financial aid | 20% |
| Are parents | 1% |
| Access Accessibility Services | 8% |
Average Class Size
21 students
(based on calendar year 2023, excludes internships, independent study, homeland security, and study abroad)
Student / Faculty Ratio
21:1
Cascadia Compared to Other State Community Colleges
Of the 34 colleges in the state, Cascadia has the highest percentage of:
- Students who register with the intent to transfer (68% of students indicated their purpose for attending was to transfer to a university)
- Students who transfer to a 4-year institution in WA
- Students who transfer to the UW-Bothell
- Our Business graduates earn $12,000 more per year than those from the other colleges (6 years after entering college).
- Our Information Technology graduates earn $17,000 more per year than those from the other colleges (6 years after entering college).
All statistics are based on data provided by the state 2024-25 academic year.